2012-06-10 // Cacti Monitoring Templates and Nagios Plugin for TMS RamSan-630
Some time ago we got two TMS RamSan-630 SAN-based flash storage arrays at work. They are integrated in our overall SAN storage architecture and thus provide their LUNs to the storage virtualization layer based on a four node IBM SVC cluster. The TMS LUNs are used in two different ways. Some are used as dedicated flash-backed MDiskGroups for applications with moderate space, but very high I/O and very low latency requirements. Some are used in existing disk-based MDiskGroups as an additional SSD-tier, using the SVCs “Easy Tier” feature to do a dynamic relocation of “hot” extends to the flash and “cold” extends from the flash. With the two different use cases we try to get an opimal use out of the TMS arrays, while simultaniously reducing the I/O load on the existing disk based storages.
So far the TMS boxes work very well, the documentation is nothing but excellent. Unlike other classic storage arrays (e.g. IBM DS/DCS, EMC Clariion, HDS AMS, etc.) the TMS arrays are conveniently self-contained. All management operations are available via a telnet/SSH interface or an embedded WebGUI, no OS-dependent management software is neccessary. All functionality is already available, no additional licenses for this and that are neccessary. Monitoring could be improved a bit, especially the long term storage of performance metrics. Unfortunately only the most important performance metrics are presented via SNMP to the outside, so you can't really fill that particular gap yourself with a third party monitoring application.
With the metrics that are available via SNMP i created a Nagios plugin for availability and health monitoring and a Cacti template for performance trends. The Nagios configuration for the TMS arrays monitors the following generic services:
ICMP ping.
Check for the availability of the SNMP daemon.
Check for SNMP traps submitted to snmptrapd and processed by SNMPTT.
in addition to those, the Nagios plugin for the TMS arrays monitors the following more specific services:
Check for the overall status (OID:
.1.3.6.1.4.1.8378.10.1.3.0).Check for the fan status (OID:
.1.3.6.1.4.1.8378.10.1.6.0.1.6).Check for the temperature status (OID:
.1.3.6.1.4.1.8378.10.1.6.1.1.6).Check for the power status (OID:
.1.3.6.1.4.1.8378.10.1.6.2.1.6).Check for the FC connectivity status (OID:
.1.3.6.1.4.1.8378.10.2.1.5).
The Cacti templates graph the following metrics:
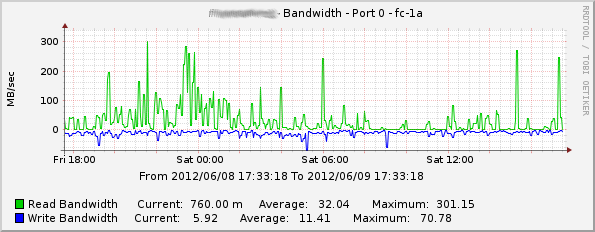
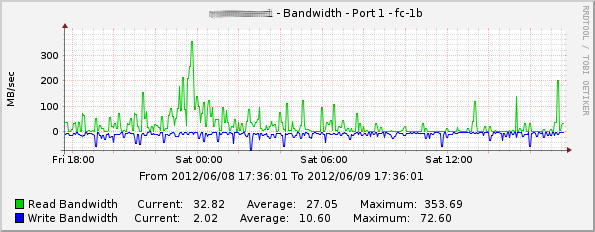
FC port bandwidth usage.
Example Read/Write Bandwidth on Port fc-1a:
Example Read/Write Bandwidth on Port fc-1b:
FC port cache values (although they seem to remain at zero all the time).
FC port error values.
FC port received and transmitted frames.
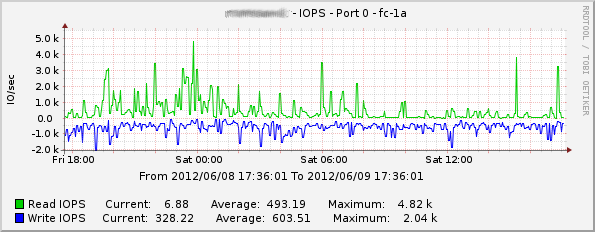
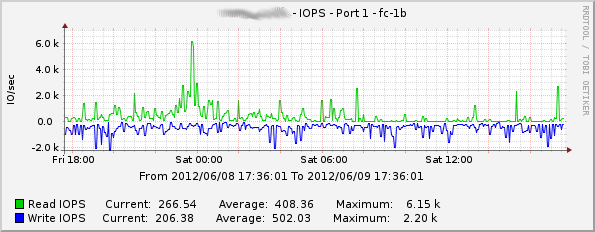
FC port I/O operations.
Example Read/Write IOPS on Port fc-1a:
Example Read/Write IOPS on Port fc-1b:
Fan speed values.
Voltage and current values.
Temperature values.
The Nagios Plugin and the Cacti templates can be downloaded here Nagios Plugin and Cacti Templates. Beware that they should be considered as quick'n'dirty hacks which should generally work but don't come with any warranty of any kind 


