2013-11-15 // Cacti Monitoring Templates for TMS RamSan and IBM FlashSystem
This is another update to the previous posts about Cacti Monitoring Templates and Nagios Plugin for TMS RamSan-630 and Cacti Monitoring Templates for TMS RamSan-630 and RamSan-810. Three major changes were done in this version of the Cacti templates:
After a report from Mike R. of the templates also working for the TMS RamSan-720, i decided to drop the string “TMS RamSan-630” which was used in several places for the more general string “TMS RamSan”.
Mike R. – who is using TMS RamSan-720 systems with InfiniBand host interfaces – was also kind enough to share his adaptions to the Cacti templates for monitoring of the InfiniBand interfaces. Those adaptions have now been merged and incooperated in Cacti templates in order to allow monitoring of pure InfiniBand-based and mixed (FC and IB) systems.
After getting in touch with TMS – and later on IBM
– over the following questions on my side:
[…]
While adapting our Cacti templates to include the new SNMP counters provided in recent firmware versions i noticed, some strange behaviour when comparing the SNMP counter values with the live values via the WebGUI:
- The SNMP counters fcCacheHit, fcCacheMiss and fcCacheLookup seem always to be zero (see example 1 below).
- The SNMP counter fcRXFrames seem to always stay at the same value (see example 2 below) although the WebGUI shows them increasing. Possibly a counter overflow?
- The SNMP couters fcWriteSample* seem always to be zero (see example 3 below) although the WebGUI shows them increasing. The fcReadSample* counters don’t show this behaviour.
[…]
Also, is there some kind of roadmap for other performance counters currently only available via the WebGUI to become accessible via SNMP?
[…]i got the following response from Brian Groff over at “IBM TMS RamSan Support”:
Regarding your inquiry to the SNMP values, here are our findings:
1. The SNMP counters fcCacheHit, fcCacheMiss and fcCacheLookup are deprecated in the new Flash systems. The cache does not exist in RamSan-6xx and later models.
2. The SNMP counter fcRXFrames is intended to remain static and historically used for development purposes. Please do not use this counter for performance or usage monitoring.
3. The SNMP counters fcWriteSample and fcReadSample are also historically used for development purposes and not intended for performance or usage monitoring.
Your best approach to performance monitoring is using IOPS and bandwidth counters on a system, FC interface card, and FC interface port basis.
The list of counters in future products has not been released. We expect them to be similar to the RamSan-8xx model and primarily used to monitor IOPS and bandwidth.Based on this information i decided to remove the counters
fcCacheHit,fcCacheMissandfcCacheLookupfrom the templates as well as their InfiniBand counterpartsibCacheHit,ibCacheMissandibCacheLookup. I decided to keepfcRXFramesandfcWriteSample*in the templates, since their counterpartsfcTXFramesandfcReadSample*seem to produce valid values. This way the users of the Cacti templates can – based on the information provided above – decide on their own whether to graph those counters or not.
To be honest, the contact with TMS/IBM was a bit disappointing and less than enthusiastic. On an otherwise really great product, i'd wish for a bit more open mindedness when it comes to 3rd party monitoring tools through an industry standard like the SNMP protocol. Once again i got the feeling that SNMP was the ugly stepchild, which was only implemented to be able to check it off the “got to have” list in the first place. True, inside the WebGUI all the metrics are there, but that's another one of those beloved isolated monitoring application right there. Is it really that hard to expose the already collected metrics from the WebGUI via SNMP to the outside?
The Nagios plugins and the updated Cacti templates can be downloaded here Nagios Plugin and Cacti Templates.
2013-01-27 // Cacti Monitoring Templates for TMS RamSan-630 and RamSan-810
This is an update to the previous post about Cacti Monitoring Templates and Nagios Plugin for TMS RamSan-630. With the two new RamSan-810 we got and the new firmware releases available for our existing RamSan-630, an update to the previously introduced Cacti templates and Nagios plugins seemed to be in order. The good news is, the new Cacti templates can still be used for older firmware versions, the graphs depending on newer performance counters will just remain empty. I suspect they'll work for all 6x0, 7x0 and 8x0 models. Also good news, the RamSan-630 and the RamSan-810 have basically the same SNMP MIB:
There are just some nomencalture differences with regard to the product name, so the same Cacti templates can be used for either RamSan-630 or RamSan-810 systems. For historic reasons the string “TMS RamSan-630” still appears in several template names.
As the release notes for current firmware versions mention, several new SNMP counters have been added:
** Release 5.4.6 - May 17, 2012 **
[N 23014] SNMP MIB now includes a new table for flashcard information.

** Release 5.4.5 - May 2, 2012 **
[N 23014] SNMP MIB now includes interface stats for transfer latency and DMA command sizes.
A diff on the two RamSan-630 MIBs mentioned above shows the new SNMP counters:
fcReadAvgLatency
fcWriteAvgLatency
fcReadMaxLatency
fcWriteMaxLatency
fcReadSampleLow
fcReadSampleMed
fcReadSampleHigh
fcWriteSampleLow
fcWriteSampleMed
fcWriteSampleHigh
fcscsi4k
fcscsi8k
fcscsi16k
fcscsi32k
fcscsi64k
fcscsi128k
fcscsi256k
fcRMWCount

flashTableIndex
flashObject
flashTableState
flashHealthState
flashHealthPercent
flashSizeMiB
With a little bit of reading through the MIB and comparing the new SNMP counters to the corresponding performance counters in the RamSan web interface, the following metrics were added to the Cacti templates:
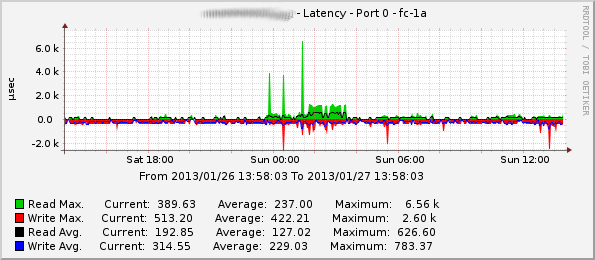
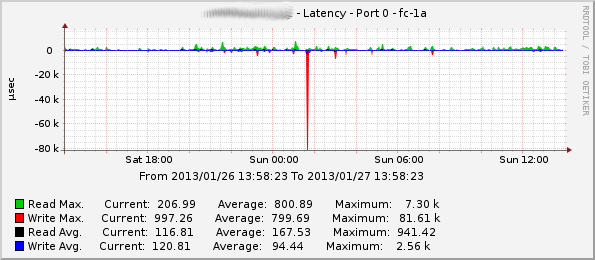
FC port average and maximum read and write latency measured in microseconds.
Example RamSan-630 Average and Maximum Read/Write Latency on Port fc-1a:
Example RamSan-810 Average and Maximum Read/Write Latency on Port fc-1a:
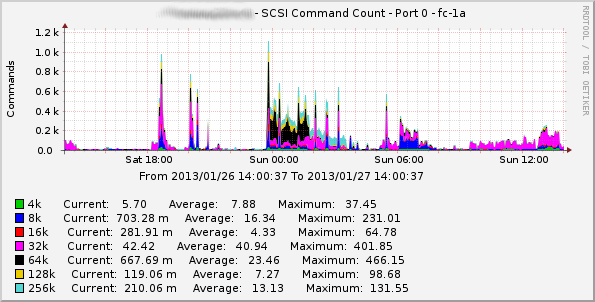
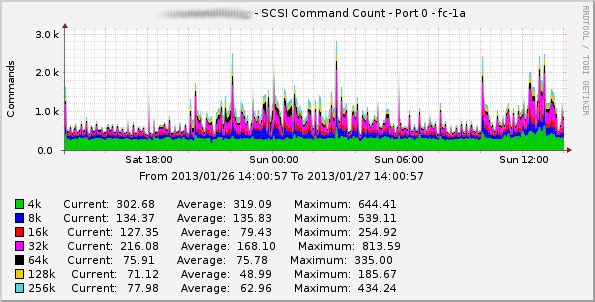
FC port SCSI command count grouped by the SCSI command size.
Example RamSan-630 SCSI Command Count on Port fc-1a:
Example RamSan-810 SCSI Command Count on Port fc-1a:
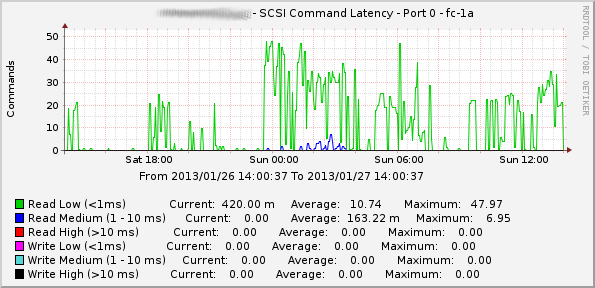
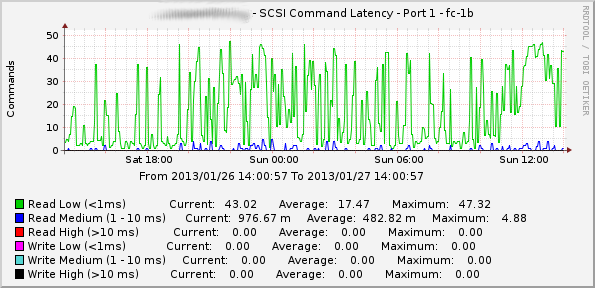
FC port SCSI command latency grouped by latency classes (low, medium, high).
Example RamSan-630 SCSI Command Latency on Port fc-1a:
Example RamSan-810 SCSI Command Latency on Port fc-1a:
FC port read-modify-write command count (although they seem to remain at the maximum value for 32bit signed integer all the time).
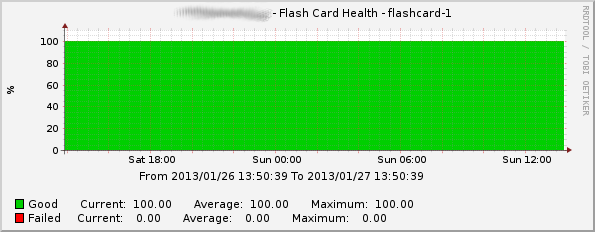
Flashcard health percentage (good vs. failed flash cells).
Example Health Status of Flashcard flashcard-1:
Flashcard size.
There still seem to be some issues with the existing and the new SNMP counters. For example the fcCacheHit, fcCacheMiss and fcCacheLookup counters always remain at a zero value. The fcRXFrames counter always stays at the same value (2147483647), which is the maximum for a 32bit signed integer and could suggest a counter overflow. The fcWriteSample* counters also seem to
remain at a zero value even though the corresponding performance counters in the RamSan web interface show a steady growth.
Since there are still some performance counters left that are only accessible via the web interface, there's still some room for improofment. I hope with the aquisition by IBM we'll see some more and interesting changes in the future.
The Nagios plugins and the updated Cacti templates can be downloaded here Nagios Plugin and Cacti Templates.
2012-06-10 // Cacti Monitoring Templates and Nagios Plugin for TMS RamSan-630
Some time ago we got two TMS RamSan-630 SAN-based flash storage arrays at work. They are integrated in our overall SAN storage architecture and thus provide their LUNs to the storage virtualization layer based on a four node IBM SVC cluster. The TMS LUNs are used in two different ways. Some are used as dedicated flash-backed MDiskGroups for applications with moderate space, but very high I/O and very low latency requirements. Some are used in existing disk-based MDiskGroups as an additional SSD-tier, using the SVCs “Easy Tier” feature to do a dynamic relocation of “hot” extends to the flash and “cold” extends from the flash. With the two different use cases we try to get an opimal use out of the TMS arrays, while simultaniously reducing the I/O load on the existing disk based storages.
So far the TMS boxes work very well, the documentation is nothing but excellent. Unlike other classic storage arrays (e.g. IBM DS/DCS, EMC Clariion, HDS AMS, etc.) the TMS arrays are conveniently self-contained. All management operations are available via a telnet/SSH interface or an embedded WebGUI, no OS-dependent management software is neccessary. All functionality is already available, no additional licenses for this and that are neccessary. Monitoring could be improved a bit, especially the long term storage of performance metrics. Unfortunately only the most important performance metrics are presented via SNMP to the outside, so you can't really fill that particular gap yourself with a third party monitoring application.
With the metrics that are available via SNMP i created a Nagios plugin for availability and health monitoring and a Cacti template for performance trends. The Nagios configuration for the TMS arrays monitors the following generic services:
ICMP ping.
Check for the availability of the SNMP daemon.
Check for SNMP traps submitted to snmptrapd and processed by SNMPTT.
in addition to those, the Nagios plugin for the TMS arrays monitors the following more specific services:
Check for the overall status (OID:
.1.3.6.1.4.1.8378.10.1.3.0).Check for the fan status (OID:
.1.3.6.1.4.1.8378.10.1.6.0.1.6).Check for the temperature status (OID:
.1.3.6.1.4.1.8378.10.1.6.1.1.6).Check for the power status (OID:
.1.3.6.1.4.1.8378.10.1.6.2.1.6).Check for the FC connectivity status (OID:
.1.3.6.1.4.1.8378.10.2.1.5).
The Cacti templates graph the following metrics:
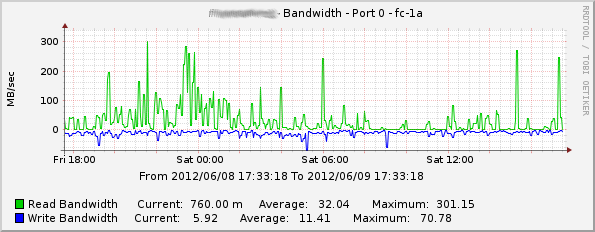
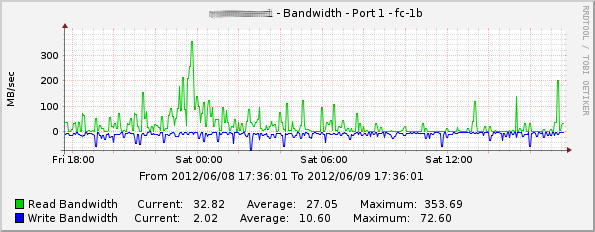
FC port bandwidth usage.
Example Read/Write Bandwidth on Port fc-1a:
Example Read/Write Bandwidth on Port fc-1b:
FC port cache values (although they seem to remain at zero all the time).
FC port error values.
FC port received and transmitted frames.
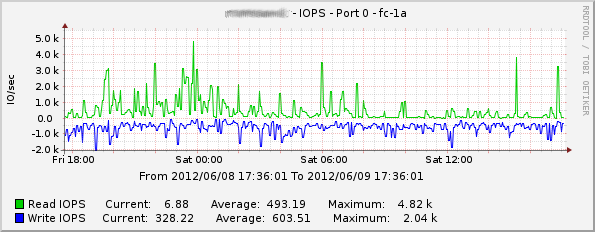
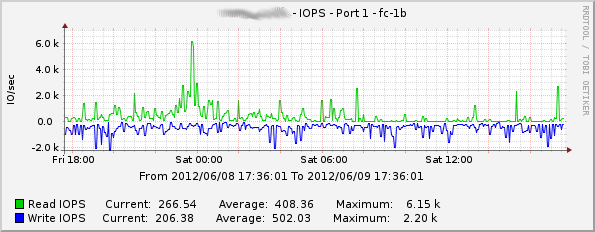
FC port I/O operations.
Example Read/Write IOPS on Port fc-1a:
Example Read/Write IOPS on Port fc-1b:
Fan speed values.
Voltage and current values.
Temperature values.
The Nagios Plugin and the Cacti templates can be downloaded here Nagios Plugin and Cacti Templates. Beware that they should be considered as quick'n'dirty hacks which should generally work but don't come with any warranty of any kind 
