2013-06-29 // An Example of Flash Storage Performance - IBM Tivoli Storage Manager (TSM)
With all the buzz and hype around flash storage, maybe you already asked yourself if flash based storage is really what it's cracked up to be. Maybe your already convinced, that flash based storage can ease or even solve some of the issues and challanges you're facing within your infrastructure, but you need some numbers to convince upper managment to provide the necessary – and still quite substancial – funding for it. Well, in any case here's a hands on, before-and-after example of the use of flash based storage.
Initial Setup
We're currently running two IBM Tivoli Storage Manager (TSM) servers for our backup infrastructure. They're still on TSM version 5.5.7.0, so the dreaded hard limit of 13GB for the transaction log space of the catalog database applies. The databases on each TSM server are around 100GB in size. The database volumes as well as the transaction log volumes reside on RAID-1 LUNs provided by two IBM DCS3700 storage systems, which are distributed over two datacenters. The LUNs are backed by 300GB 15k RPM SAS disks. Redundancy is provided by TSM database and transaction log volume mirroring over the two storage systems. The two DCS3700 and the TSM server hardware (IBM Power with AIX) are attached to a dual-fabric 8Gbit FC SAN. The following image shows an overview of the whole backup infrastructure, with some additional components not discussed in this context:
Performance Problems
With the increasing number of Windows 2008 servers to be backed up as TSM clients, we noticed very heavy database and transaction log activity on the TSM servers. At busy times, this would even lead to a situation where the 12GB transaction logs would fill up and a manual recovery of the TSM server would be necessary. The strain on the database was so high, that the database backup process triggered to free up transaction log space would just sit there, showing no activity. Sometimes two hours would pass between the start of the database backup process and the first database pages being processed. After some research and raising a PMR with IBM, it turned out the handling of the Windows 2008 system state backup was modeled with the DB2 backed catalog database of TSM version 6 in mind. The TSM version 5 embedded database was apparently not considered any more and just not up to the task (see IBM TSM Flash "Windows system state backup with a V5 Tivoli Storage Manager server"). So the suggested solutions were:
Migration to TSM server version 6.
Spread client backup windows over time and/or setup up additional TSM server instances to take over the load.
Disable Windows system state backup.
For various reasons we ended up with spreading the system state backup of the Windows clients over time, which allowed use to get by for quite some time. But in the end even this didn't help anymore.
Flash Solution
Luckyly, around that time we still had some free space leftover on our four TMS RamSan 630 and 810 systems. After updating the OS of the TSM servers to AIX 6.1.8.2 and installing iFix IV38225, we were able to attach the flash based LUNs with proper multipathing support. We then moved the database and transaction log volume groups over to the flash storage with the AIX migratepv command. The effect was incredible and instantaneous – without any other changes to the client or server environment, the database backup trigger at 50% transaction log space didn't fire even once during the next backup window! Gathering the available historical runtime data of database backup processes and graphing them over time confirmed the increadible performance gain for database backups on both TSM server instances:
Another I/O intensive operation on the TSM server is the expiration of backup and archive objects to be deleted from the catalog database. In our case this process is run on a daily basis on each TSM server. With the above results chances were, that we'd see an improvement in this area too. Like above we gathered the available historical runtime data of expire inventory processes and graphed them over time:
Monitoring the situation for several weeks after the migration to flash based storage volumes, showed us several interesting facts we found to be characteristic in our overall experience of flash vs. disk based storage:
As expected an increased number of I/O operations per second (IOPS) and thus a generally increased throughput.
In this particular case this is reflected by a number of symptoms:
A largely reduced number of unintended database backups that were triggered by a filling transaction log.
A generally lower transaction log usage, which was probably due to more database transactions being able to complete in time due to the increased number of available IOPS.
A largely reduced runtime of the deliberate database backups and the expire inventory processes started as part of the daily TSM server maintenance.
A very low variance of the response time, which is independend of the load on the system. This is especially in contrast to disk based storage systems, where one can observe a snowballing effect of increasing latency under medium and heavy load. In the above example graphs this is represented indirectly by the low level runtime plateau after the migration to flash based storage.
A shift of the performance bottleneck into other areas. Previously the quite convenient excuse on performance issues was disk I/O and the best measure the reduction of the same. With the introduction of flash based storage the focus has shifted and other areas like CPU, memory, network and storage-network latency are now put in the spotlight.
2012-06-10 // Cacti Monitoring Templates and Nagios Plugin for TMS RamSan-630
Some time ago we got two TMS RamSan-630 SAN-based flash storage arrays at work. They are integrated in our overall SAN storage architecture and thus provide their LUNs to the storage virtualization layer based on a four node IBM SVC cluster. The TMS LUNs are used in two different ways. Some are used as dedicated flash-backed MDiskGroups for applications with moderate space, but very high I/O and very low latency requirements. Some are used in existing disk-based MDiskGroups as an additional SSD-tier, using the SVCs “Easy Tier” feature to do a dynamic relocation of “hot” extends to the flash and “cold” extends from the flash. With the two different use cases we try to get an opimal use out of the TMS arrays, while simultaniously reducing the I/O load on the existing disk based storages.
So far the TMS boxes work very well, the documentation is nothing but excellent. Unlike other classic storage arrays (e.g. IBM DS/DCS, EMC Clariion, HDS AMS, etc.) the TMS arrays are conveniently self-contained. All management operations are available via a telnet/SSH interface or an embedded WebGUI, no OS-dependent management software is neccessary. All functionality is already available, no additional licenses for this and that are neccessary. Monitoring could be improved a bit, especially the long term storage of performance metrics. Unfortunately only the most important performance metrics are presented via SNMP to the outside, so you can't really fill that particular gap yourself with a third party monitoring application.
With the metrics that are available via SNMP i created a Nagios plugin for availability and health monitoring and a Cacti template for performance trends. The Nagios configuration for the TMS arrays monitors the following generic services:
ICMP ping.
Check for the availability of the SNMP daemon.
Check for SNMP traps submitted to snmptrapd and processed by SNMPTT.
in addition to those, the Nagios plugin for the TMS arrays monitors the following more specific services:
Check for the overall status (OID:
.1.3.6.1.4.1.8378.10.1.3.0).Check for the fan status (OID:
.1.3.6.1.4.1.8378.10.1.6.0.1.6).Check for the temperature status (OID:
.1.3.6.1.4.1.8378.10.1.6.1.1.6).Check for the power status (OID:
.1.3.6.1.4.1.8378.10.1.6.2.1.6).Check for the FC connectivity status (OID:
.1.3.6.1.4.1.8378.10.2.1.5).
The Cacti templates graph the following metrics:
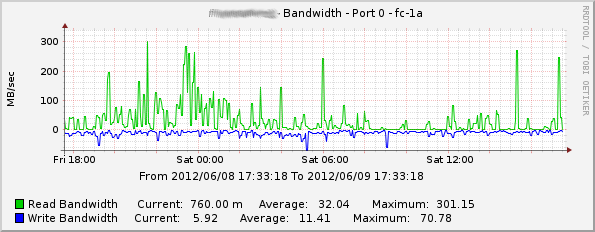
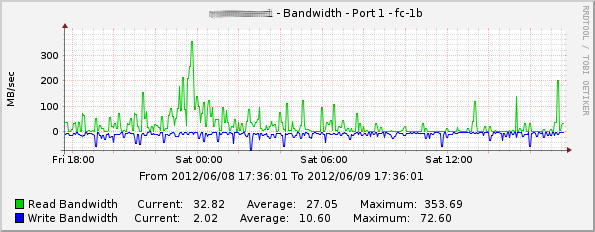
FC port bandwidth usage.
Example Read/Write Bandwidth on Port fc-1a:
Example Read/Write Bandwidth on Port fc-1b:
FC port cache values (although they seem to remain at zero all the time).
FC port error values.
FC port received and transmitted frames.
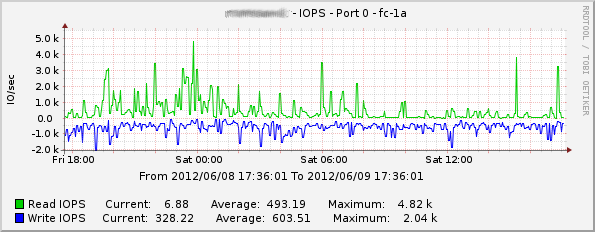
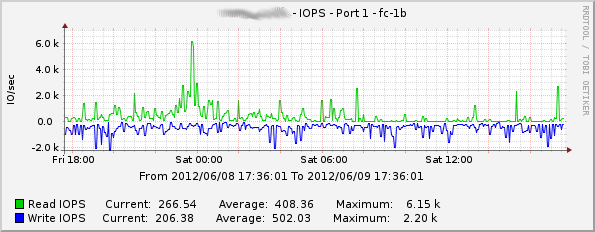
FC port I/O operations.
Example Read/Write IOPS on Port fc-1a:
Example Read/Write IOPS on Port fc-1b:
Fan speed values.
Voltage and current values.
Temperature values.
The Nagios Plugin and the Cacti templates can be downloaded here Nagios Plugin and Cacti Templates. Beware that they should be considered as quick'n'dirty hacks which should generally work but don't come with any warranty of any kind 


