2013-02-17 // Debian Wheezy on IBM Power LPAR
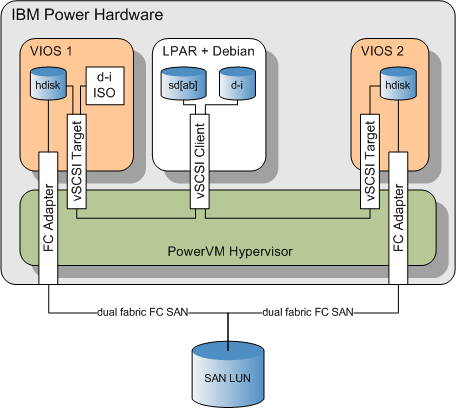
At work we're running several IBM Power LPARs with Debian as operating system. The current Debian version we're running is “squeeze” (v6.0.6), which was upgraded from the initially installed “lenny” (v5.0). Although there was some hassle with the yaboot package, the stock “lenny” Debian-Installer ISO image used back then worked as far as installing the base OS was concerned. For some reason, starting with the Debian “squeeze” release, the Debian-Installer stopped working in our setup, which looks like this:
The SAN (IBM SVC) based LUNs are mapped to two VIOS per hardware server. At the VIOS the LUNs show up as usual AIX hdisks, which are mapped to the “client” LPARs as virtual target SCSI devices (vtscsi). The LPARs have virtual client SCSI devices through which they access the mapped hdisks/LUNs. For access to CD/DVD devices from the LPAR, there are two options. Either map a physical CD/DVD device directly to the LPAR – needless to say, not very scalable or comfortable. Or place your CD/DVD media as ISO images on one of the VIOS and map those image files to the LPARs through virtual target optical devices (vtopt). The LPARs access them just like the hdisks/LUNs mentioned before, through their virtual client SCSI devices. From inside a LPAR running Linux, the setup shown above looks like this:
...
[    0.379011] scsi 0:0:1:0: Direct-Access     AIX      VDASD            0001 PQ: 0 ANSI: 3
[    0.379271] scsi 0:0:2:0: CD-ROM            AIX      VOPTA                 PQ: 0 ANSI: 4
[    0.398197] scsi 1:0:1:0: Direct-Access     AIX      VDASD            0001 PQ: 0 ANSI: 3
...
[    2.738953] sd 0:0:1:0: Attached scsi generic sg0 type 0
[    2.739123] sr 0:0:2:0: Attached scsi generic sg1 type 5
[    2.739267] sd 1:0:1:0: Attached scsi generic sg2 type 0
...
The targets 0:0:1:0 and 1:0:1:0 are the two paths to the mapped hdisk/LUN, one path for each VIOS. The target 0:0:2:0 is the mapped ISO image, it has only one path, since only one VIOS maps it to the LPAR.
Now back to the Debian-Installer, which would fail in the above setup with the following error message:
[!!] Install yaboot on a hard disk
No bootstrap partition found
No hard disks were found which have an "Apple_Bootstrap" partition.
You must create an 819200-byte partition with type "Apple_Bootstrap".
This error message is actually caused by the GNU Parted command find-partitions:
~ # /usr/lib/partconf/find-partitions --flag prep
Warning: The driver descriptor says the physical block size is 512 bytes,
but Linux says it is 2048 bytes.

A bug has been detected in GNU Parted.  Refer to the web site of
parted http://www.gnu.org/software/parted/parted.html for more
information of what could be useful for bug submitting!  Please
email a bug report to address@hidden containing at least the
version (2.3) and the following message:  Assertion (disk != NULL)
at ../../libparted/disk.c:1548 in function ped_disk_next_partition()
failed.  Aborted
A test with the current “whezzy” Debian-Installer quickly showed the same behaviour. Running the above find-partitions command manually within a shell from the running Debian-Installer and with a copied over strace sched some more light on the root cause of the problem:
~ # /tmp/strace -e trace=!_llseek,read /usr/lib/partconf/find-partitions --flag prep
...
open("/dev/mapper/vg00-swap", O_RDWR|O_LARGEFILE) = 3
mmap(NULL, 528384, PROT_READ|PROT_WRITE, MAP_PRIVATE|MAP_ANONYMOUS, -1, 0) =
0xf7dda000
munmap(0xf7dda000, 528384)              = 0
mmap(NULL, 528384, PROT_READ|PROT_WRITE, MAP_PRIVATE|MAP_ANONYMOUS, -1, 0) =
0xf7dda000
munmap(0xf7dda000, 528384)              = 0
mmap(NULL, 528384, PROT_READ|PROT_WRITE, MAP_PRIVATE|MAP_ANONYMOUS, -1, 0) =
0xf7dda000
munmap(0xf7dda000, 528384)              = 0
mmap(NULL, 528384, PROT_READ|PROT_WRITE, MAP_PRIVATE|MAP_ANONYMOUS, -1, 0) =
0xf7dda000
munmap(0xf7dda000, 528384)              = 0
mmap(NULL, 528384, PROT_READ|PROT_WRITE, MAP_PRIVATE|MAP_ANONYMOUS, -1, 0) =
0xf7dda000
munmap(0xf7dda000, 528384)              = 0
mmap(NULL, 528384, PROT_READ|PROT_WRITE, MAP_PRIVATE|MAP_ANONYMOUS, -1, 0) =
0xf7dda000
munmap(0xf7dda000, 528384)              = 0
fsync(3)                                = 0
close(3)                                = 0
open("/dev/sr0", O_RDWR|O_LARGEFILE)    = 3
fsync(3)                                = 0
close(3)                                = 0
open("/dev/sr0", O_RDWR|O_LARGEFILE)    = 3
write(2, "Warning: ", 9Warning: )                = 9
write(2, "The driver descriptor says the p"..., 98The driver descriptor says
the physical block size is 512 bytes, but Linux says it is 2048 bytes.
) = 98
fsync(3)                                = 0
close(3)                                = 0
write(2, "A bug has been detected in GNU P"..., 299A bug has been detected in
GNU Parted.  Refer to the web site of parted
http://www.gnu.org/software/parted/parted.html for more information of what
could be useful for bug submitting!  Please email a bug report to) and the
following message:  ) = 299st the version (2.3--More--
write(2, "Assertion (disk != NULL) at ../."..., 102Assertion (disk != NULL) at
../../libparted/disk.c:1548 in function ped_disk_next_partition() failed.
) = 102
rt_sigprocmask(SIG_UNBLOCK, [ABRT], NULL, 8) = 0
gettid()                                = 13874
tgkill(13874, 13874, SIGABRT)           = 0
--- SIGABRT (Aborted) @ 0 (0) ---
+++ killed by SIGABRT +++
Processing stopped at /dev/sr0 which is the Debian-Installer ISO image mapped through the vtopt device to the LPAR. Apparently the ibmvscsi kernel module reports a block size of 512 bytes for the device, but as it is a ISO image of a CD/DVD, the logical block size is 2048 bytes. The GNU parted libraries used by find-partitions stumble upon this discrepancy.
Since in case of the Debian-Installer the CD/DVD media the installer is booted from isn't a target one would be interested installing the system on, the easy fix would be to just skip all CD/DVD type devices. This could be done by the following quick'n'dirty patch to find-partitions:
- find-partitions_d-i_install_LPAR_from_vopt.patch
--- partconf.orig/find-parts.c  2013-02-15 16:35:30.394743001 +0100
+++ partconf/find-parts.c   2013-02-16 16:58:17.090742993 +0100
diff -rui partconf.orig/find-parts.c partconf/find-parts.c
@@ -175,6 +175,7 @@
     PedDevice *dev = NULL;
     PedDisk *disk;
     PedPartition *part;
+    struct stat st;

     ped_device_probe_all();
     while ((dev = ped_device_get_next(dev)) != NULL) {
@@ -182,6 +183,9 @@
             continue;
         if (strstr(dev->path, "/dev/mtd") == dev->path)
             continue;
+        if (stat(dev->path, &st) == 0)
+            if (major(st.st_rdev) == 11)
+                continue;
         if (!ped_disk_probe(dev))
             continue;
         disk = ped_disk_new(dev);
A patched find-partitions can be downloaded here and should be copied over into the directory /usr/lib/partconf/ of the running Debian-Installer system, once the error shown above is occurring. Hopefully a fixed version of find-partitions will be accepted for the final release of the wheezy installer and this workaround won't be necessary anymore. For further information see the discussion on the debian-powerpc mailing list and the corresponding Debian bug reports 332227, 350372 and 352914.
Besides this issue, the current RC of the Debian “wheezy” installer worked very well on a test LPAR on current Power7 hardware.
2013-02-10 // TSM DLLA Procedure Performance
Some time ago we were hit by the dreaded DB corruption on one of our TSM 5.5.5.2 server instances. Upon investigating the object IDs with the hidden SHOW INVO command, we found which objects were exactly affected – some Windows filesystem backups and Oracle database archivelog backup – and re-backuped them. Getting rid of the broken remains was not so easy though. The usual AUDIT VOLUME … FIX=YES took care of some of the issues, but not all. Because of those remaining defect objects and database entries we're seeing error messages:
ANR9999D_0902881829 DetermineBackupRetention(imexp.c:7812) Thread<1150837>: No inactive versions found for 0:392144678
ANR9999D Thread<1150837> issued message 9999 from:
ANR9999D Thread<1150837>  000000010000c7e8 StdPutText
ANR9999D Thread<1150837>  000000010000fb90 OutDiagToCons
ANR9999D Thread<1150837>  000000010000a2d0 outDiagfExt
ANR9999D Thread<1150837>  0000000100784bcc DetermineBackupRetention
ANR9999D Thread<1150837>  0000000100789024 ExpirationQualifies
ANR9999D Thread<1150837>  000000010078b48c ExpirationProcess
ANR9999D Thread<1150837>  000000010078e550 ImDoExpiration
ANR9999D Thread<1150837>  000000010001509c StartThread
ANR9999D_2753579289 ExpirationQualifies(imexp.c:5116) Thread<1150837>: DetermineBackupRetention for 0:392144678 failed, rc=19
ANR9999D Thread<1150837> issued message 9999 from:
ANR9999D Thread<1150837>  000000010000c7e8 StdPutText
ANR9999D Thread<1150837>  000000010000fb90 OutDiagToCons
ANR9999D Thread<1150837>  000000010000a2d0 outDiagfExt
ANR9999D Thread<1150837>  000000010078905c ExpirationQualifies
ANR9999D Thread<1150837>  000000010078b48c ExpirationProcess
ANR9999D Thread<1150837>  000000010078e550 ImDoExpiration
ANR9999D Thread<1150837>  000000010001509c StartThread
on the daily EXPIRE INVENTORY and the content of some tape volumes cannot be moved or reclaimed. Calling up TSM support at IBM was not as helpful as we hoped. Although there are – undocumented – commands to manipulate database entries directly, we were told the only way to clean up the logical inconsistencies was to perform a DUMPDB / LOADFORMAT / LOADDB / AUDITDB (DLLA) procedure or to create a new TSM server instance and move over all nodes from the broken instance.
We went for the first option, the DLLA procedure. The runtime of the DLLA procedure, and thus the downtime for the TSM server, depends largely on the size of the database, the number of objects in the database and probably the number of inconsistencies too. Since there was no way to even roughtly estimate the runtime, we decided to test the DLLA procedure on a non-production test system. This way we could also familiarize ourselfs with the steps needed – luckily this kind of activity does not fall in the category of regular duties for a TSM admin – and also check whether the issues were actually resolved by the DLLA procedure. There's actually a good chance they won't and you'd have to fall back to the second option of creating a new TSM server instance and moving over all nodes and their data via node export/import!
We're running TSM 5.5.5.2 within AIX 6.1 LPARs, the test system had the exact same versions. The database size is 96GB with ~650 Mio. objects. We tried a lot of different test setups to optimize the DLLA runtime, the main iterations where the most gain in runtime was visible were:
Test 1 (Initial test): Power6+ @5Ghz; 2 shared CPUs; Dump FS, DB and Log disks on SVC LUNs provided by a EMC Clariion with 15k FC disks.
Test 2: Power6+ @5Ghz; 2 shared CPUs; Dump FS, DB and Log disks on SVC LUNs provided by a TMS RamSan-630 flash array.
Test 3: Power6+ @5Ghz; 3 dedicated CPUs; DB and Log on RamDisk devices; Dump FS on on SVC LUNs provided by a TMS RamSan-630 flash array.
Test 4: Power7 @3.1Ghz; 4 dedicated CPUs; DB and Log on RamDisk devices; Dump FS on on SVC LUNs provided by a TMS RamSan-630 flash array.
The runtime for each DLLA step in those iterations was:
| DLLA Step | Runtime (h = hours, m = minutes, s = seconds) | |||
|---|---|---|---|---|
| Test 1 | Test 2 | Test 3 | Test 4 | |
| DUMPDB | 0h 15m | 0h 5m | 0h 4m 11s | 0h 3m 12s |
| LOADFORMAT | – | – | 0h 0m 20s | 0h 0m 13s |
| LOADDB | 11h 30m | 4h 45m | 4h 54m 55s | 3h 15m 4s |
| AUDITDB | 30h | 9h 36m | 7h 34m 14s | 5h 18m 55s |
| SUM | ~41h 45m | ~14h 26m | ~12h 33m 40s | ~8h 37m 24s |
As those numbers show there is a vast room for runtime improvement. Between Test 1 and 2 the runtime dropped to almost 1/3rd in both LOADDB and AUDITDB. Since the change between Test 1 and 2 was the move of the storage to a system that is very good at low latency, random I/O, it's save to say setup was I/O bound in Test 1.
Having an I/O bound system we tried to lift this restraint further by moving to RamDisk based DB and Log volumes in Test 3. There was also the suspicion that the sheduling of the shared CPU resources back and forth between the LPAR and the hypervisor could have a negative impact. To mitigate this we also switched to dedicated CPU assignments. Unfortunately the result of Test 3 was “only” another 2 hours of reduction in runtime.
While observing the systems activity during the LOADDB and AUDITDB phases with different system monitoring tools, including truss, we noticed a rather high level of activity in the area of pthreads. Altough the Power7 systems at hand had a lower clock rate than the Power6+ systems, the connection between memory and CPU is very much improved with Power7. Especially thread intercommunication and synchronisation should benefit from this. The result of the move to Power7 (Test 4) is another 4 hours of reduction in runtime.
The end result of approximately 8.5 hours of DLLA runtime is still a lot, but much more manageable than the initial 42 hours in terms of a possible downtime window. Considering the kind of hardware resources we've to throw at this issue it makes one wonder how TSM support and development could see the DLLA procedure as a actually valid way to resolve inconsistencies in the TSM database. The whole process, as well as each of its steps, appear to be implemented horribly inefficient and they're eating resources like crazy. I know that the development of TSM 5.x virtually dried up some time ago with the advent of TSM 6.x and its DB2 database backend. But should one really believe that in the past there was never time nor the necessity to come up with another, more practical way to deal with TSM database issues?
2013-02-10 // HMC Update to 7.7.6.0 SP1
Compared to the previous ordeal of the HMC Update to 7.7.5.0 the recent HMC update to v7.7.6.0 SP1 went smooth as silk. Well, as long as one had enough patience to wait for the versions to stabilize. IBM released v7.7.6.0 (MH01326), an eFix for v7.7.6.0 (MH01328) and v7.7.6.0 SP1 (MH01329) in short succession. Judging from this and from the pending issues and restrictions mentioned in the release notes, one could get the impression, that the new HMC versions were very forcefully – and maybe prematurely – shoved out the door in order to make the announcement date for the new Power7+ systems in October 2012.
On the upside, the new versions are now easily installable from the ISO images via the HMC GUI again. On the downside, if you're running a dual HMC setup, you might – depending on your infrastructure – still need a trip to the datacenter. This is necessary in order to shut down, disconnect or otherwise prevent your second HMC, still running at a lower code version from accessing the managed systems while the first HMC is being updated or already running the newer version. The release notes for MH01326 state this:
“Before upgrading server firmware to 760 on a CEC with redundant HMCs connected, you must disconnect or power off the HMC not being used to perform the upgrade. This restriction is enforced by the Upgrade Licensed Internal code task.”
This is kind of an annoyance, since the whole purpose of a dual HMC setup is to have a fallback in case something goes south with one of the HMCs. Unfortunately the release notes aren't very clear as to whether this restriction applies only during the update process or if you can't run different HMC versions in parallel at all. I decided to play it save and physically disconnected the second HMCs network interface, which is facing the service processor network for about two weeks until the new HMC version had proven itself to be ready for day to day use. After this grace period i updated the second HMC as well and plugged it back into the service processor network.
Like with earlier updates there are still error messages with regard to symlink creation appearing during the update process. E.g.:
HMC corrective service installation in progress. Please wait...
Corrective service file offload from remote server in progress...
The corrective service file offload was successful. Continuing with HMC service installation...
Verifying Certificate Information
Authenticating Install Packages
Installing Packages
--- Installing ptf-req ....
--- Installing RSCT ....
src-1.3.1.1-12163
rsct.core.utils-3.1.2.5-12163
rsct.core-3.1.2.5-12163
rsct.service-3.1.0.0-1
rsct.basic-3.1.2.5-12163
--- Installing CSM ....
csm.core-1.7.1.20-1
csm.deploy-1.7.1.20-1
csm_hmc.server-1.7.1.20-1
csm_hmc.hdwr_svr-7.0-3.4.0
csm_hmc.client-1.7.1.20-1
csm.server.hsc-1.7.1.20-1
--- Installing LPARCMD ....
hsc.lparcmd-2.0.0.0-1
ln: creating symbolic link `/usr/hmcrbin/lsnodeid': File exists
ln: creating symbolic link `/usr/hmcrbin/lsrsrc-api': File exists
ln: creating symbolic link `/usr/hmcrbin/mkrsrc-api': File exists
ln: creating symbolic link `/usr/hmcrbin/rmrsrc-api': File exists
--- Installing InventoryScout ....
--- Installing Pegasus ....
--- Installing service documentation ....
--- Updating baseOS ....
Corrective service installation was successful.
This time i got fed up and curious enough to search for what was actually breaking and where. After some loopback mounting and sifting through the installation ISO images i found the culprit in the shell script /images/installImages which is part of the /images/disk2.img ISO image inside the installation ISO image:
- /images/installImages
 515     # links for xCAT support - 755346
 516     if [ ! -L /usr/sbin/rsct/bin/lsnodeid ]; then
 517        ln -s /usr/sbin/rsct/bin/lsnodeid /usr/hmcrbin/lsnodeid
 518     fi
 519     if [ ! -L /usr/sbin/rsct/bin/lsrsrc-api ]; then
 520        ln -s /usr/sbin/rsct/bin/lsrsrc-api /usr/hmcrbin/lsrsrc-api
 521     fi
 522     if [ ! -L /usr/sbin/rsct/bin/mkrsrc-api ]; then
 523        ln -s /usr/sbin/rsct/bin/mkrsrc-api /usr/hmcrbin/mkrsrc-api
 524     fi
 525     if [ ! -L /usr/sbin/rsct/bin/rmrsrc-api ]; then
 526        ln -s /usr/sbin/rsct/bin/rmrsrc-api /usr/hmcrbin/rmrsrc-api
 527     fi
 528
 529     # defect 788462 - create the lspartition for the restricted shell after rsct.service rpm installed.
 530     if [ -L /opt/hsc/bin/lspartition ]
 531     then
 532        ln -s /opt/hsc/bin/lspartition /usr/hmcrbin/ 1>&2 2>/dev/null
 533     else
 534        ln -f /opt/hsc/bin/lspartition /usr/hmcrbin/ 1>&2 2>/dev/null
 535     fi
So this is either a semantic error and the goal was actually to check for the symlinks to be created already being present, in which case e.g. /usr/hmcrbin/lsnodeid should be in the test brakets. Or this is not a semantic error, in which case the aforementioned test for the symlinks to be created already being present should actually be implemented or the symlink creation should be forced (“-f” flag). Besides that i would've probably handled the symlink creation in the RPM that installs the binaries in the first place. Well lets open a PMR on this and find out what IBM thinks about this issue.
Another issue - although a minor one - with the above code expamle is in lines 532 and 534. The shells I/O redirection is used in the wrong order, causing STDOUT to be redirected to STDERR instead of - what was probably intended - both being redirected to /dev/null.
Aside from that we're currently not experiencing any issues with the new HMC version. I've opened up a RPQ to get the feature 5799 - HMC remote restart function, which is again supported with v7.7.6.0 SP1 (MH01329). This will come in quite handy for the simplification of our disaster recovery procedures. But that'll be material for another post. Stay tuned until then …
2013-01-27 // Cacti Monitoring Templates for TMS RamSan-630 and RamSan-810
This is an update to the previous post about Cacti Monitoring Templates and Nagios Plugin for TMS RamSan-630. With the two new RamSan-810 we got and the new firmware releases available for our existing RamSan-630, an update to the previously introduced Cacti templates and Nagios plugins seemed to be in order. The good news is, the new Cacti templates can still be used for older firmware versions, the graphs depending on newer performance counters will just remain empty. I suspect they'll work for all 6x0, 7x0 and 8x0 models. Also good news, the RamSan-630 and the RamSan-810 have basically the same SNMP MIB:
There are just some nomencalture differences with regard to the product name, so the same Cacti templates can be used for either RamSan-630 or RamSan-810 systems. For historic reasons the string “TMS RamSan-630” still appears in several template names.
As the release notes for current firmware versions mention, several new SNMP counters have been added:
** Release 5.4.6 - May 17, 2012 **
[N 23014] SNMP MIB now includes a new table for flashcard information.

** Release 5.4.5 - May 2, 2012 **
[N 23014] SNMP MIB now includes interface stats for transfer latency and DMA command sizes.
A diff on the two RamSan-630 MIBs mentioned above shows the new SNMP counters:
fcReadAvgLatency
fcWriteAvgLatency
fcReadMaxLatency
fcWriteMaxLatency
fcReadSampleLow
fcReadSampleMed
fcReadSampleHigh
fcWriteSampleLow
fcWriteSampleMed
fcWriteSampleHigh
fcscsi4k
fcscsi8k
fcscsi16k
fcscsi32k
fcscsi64k
fcscsi128k
fcscsi256k
fcRMWCount

flashTableIndex
flashObject
flashTableState
flashHealthState
flashHealthPercent
flashSizeMiB
With a little bit of reading through the MIB and comparing the new SNMP counters to the corresponding performance counters in the RamSan web interface, the following metrics were added to the Cacti templates:
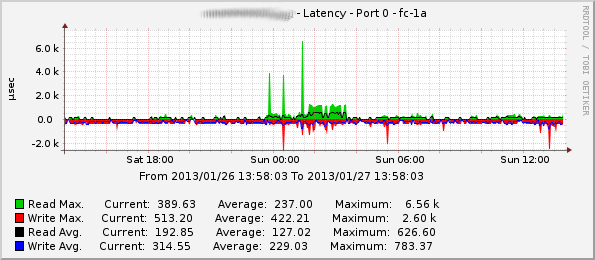
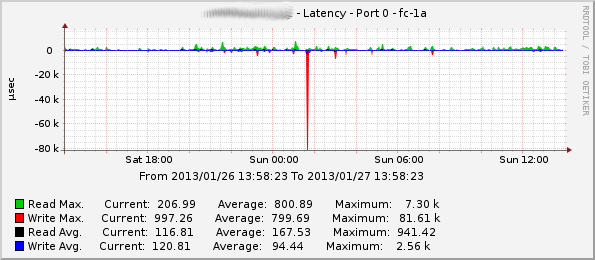
FC port average and maximum read and write latency measured in microseconds.
Example RamSan-630 Average and Maximum Read/Write Latency on Port fc-1a:
Example RamSan-810 Average and Maximum Read/Write Latency on Port fc-1a:
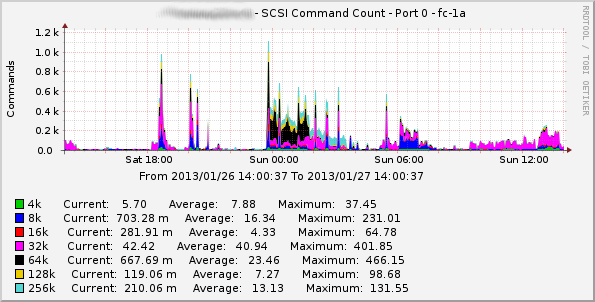
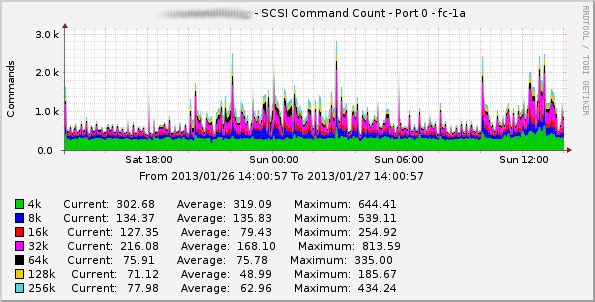
FC port SCSI command count grouped by the SCSI command size.
Example RamSan-630 SCSI Command Count on Port fc-1a:
Example RamSan-810 SCSI Command Count on Port fc-1a:
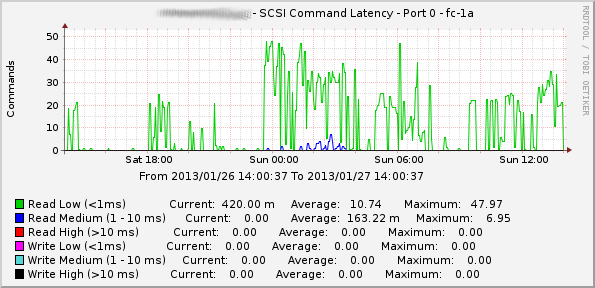
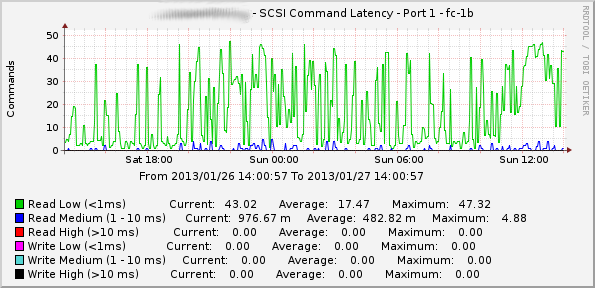
FC port SCSI command latency grouped by latency classes (low, medium, high).
Example RamSan-630 SCSI Command Latency on Port fc-1a:
Example RamSan-810 SCSI Command Latency on Port fc-1a:
FC port read-modify-write command count (although they seem to remain at the maximum value for 32bit signed integer all the time).
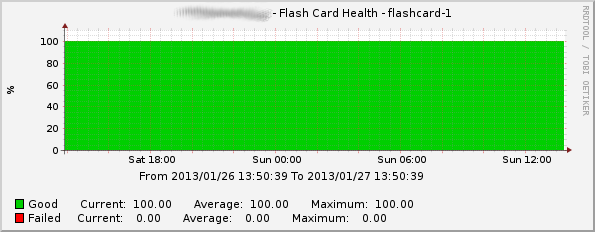
Flashcard health percentage (good vs. failed flash cells).
Example Health Status of Flashcard flashcard-1:
Flashcard size.
There still seem to be some issues with the existing and the new SNMP counters. For example the fcCacheHit, fcCacheMiss and fcCacheLookup counters always remain at a zero value. The fcRXFrames counter always stays at the same value (2147483647), which is the maximum for a 32bit signed integer and could suggest a counter overflow. The fcWriteSample* counters also seem to
remain at a zero value even though the corresponding performance counters in the RamSan web interface show a steady growth.
Since there are still some performance counters left that are only accessible via the web interface, there's still some room for improofment. I hope with the aquisition by IBM we'll see some more and interesting changes in the future.
The Nagios plugins and the updated Cacti templates can be downloaded here Nagios Plugin and Cacti Templates.
2013-01-20 // Nagios Plugins - Hostname vs. IP-Address
For obvious reasons i usually like to keep monitoring systems as independent as possible from other services (like e.g. DNS). That's why i mostly use IP addresses instead of hostnames or FQDNs when configuring hosts and services in Nagios. So a typical Nagios command configuration stanza would look like this:
define command {
    command_name    <name>
    command_line    <path>/<executable> -H $HOSTADDRESS$ <args>
}
Now, for example to check for date and time differences between the server OS and the actual time provided by our time servers, i've defined the following NRPE command on each server:
command[check_time]=<nagios plugin path>/check_ntp_time -w $ARG1$ -c $ARG2$ -H $ARG3$
On the Nagios server i've defined the following Nagios command in /etc/nagios-plugins/config/check_nrpe.cfg:
# 'check_nrpe_time' command definition
define command {
    command_name    check_nrpe_time
    command_line    $USER1$/check_nrpe -H '$HOSTADDRESS$' -c check_time -a $ARG1$ $ARG2$ $ARG3$
}
And the following Nagios service definitions are assigned to the various server groups:
# check_nrpe_time: ntp time check to NTP-1
define service {
    ...
    service_description     Check_time_NTP-1
    check_command           check_nrpe_time!<warn level>!<crit level>!10.1.1.1
}

# check_nrpe_time: ntp time check to NTP-2
define service {
    ...
    service_description     Check_time_NTP-2
    check_command           check_nrpe_time!<warn level>!<crit level>!10.1.1.2
}
The help output of check_ntp_time reads:
 ...
 -H, --hostname=ADDRESS
    Host name, IP Address, or unix socket (must be an absolute path)
 ...
which i believed to implicitly mean that the Nagios plugin knows how to differenciate between hostnames and IP addresses and behave accordingly. Unfortunately this assumption turned out to be wrong.
Recently our support group responsible for the MS ADS had trouble with the DNS service provided by the domain controllers. Probably due to a data corruption, the DNS service couldn't resolve hostnames for some, but not all, of our internally used domains anymore. Unfortunately, the time servers mentioned above are located in a domain that was affected by this issue. As a result the above checks started to fail, although they were thought to be configured to use IP addresses.
The usual head scratching, debugging, testing and putting the pieces together ensued. After looking through the Nagios Plugins source code it became clear that hostnames and IP addresses aren't treated different at all, getaddrinfo() is called indiscriminately. Since in case of an IP address this is not only unnecessary, but might also not be what was actually intended, i wrote a patch nagios-plugins_do_not_resolve_IP_address.patch for the current nagios-plugins-1.4.16 sources to fix this issue.
