2016-05-16 // Check_MK Monitoring - Dell PowerConnect Switches
Dell PowerConnect and Dell PowerConnect M-Series switches can – with regard to their most important aspects like CPU, fans, PSU and temperature – already be monitored with the standard Check_MK distribution. This article introduces an enhanced version and additional Check_MK service checks to monitor additional aspects of Dell PowerConnect switches. It is targeted mainly towards the Dell PowerConnect M-Series switches used in Dell PowerEdge M1000e blade chassis, but can probably be used on standalone Dell PowerConnect switches as well.
For the impatient and TL;DR here is the Check_MK package of the enhanced version of the Dell PowerConnect monitoring checks:
Enhanced version of the Dell PowerConnect monitoring checks (Compatible with Check_MK versions 1.2.6 and earlier)
Enhanced version of the Dell PowerConnect monitoring checks (Compatible with Check_MK versions 1.2.8 and later)
The sources are to be found in my Check_MK repository on GitHub
The Dell PowerConnect M-Series switches to be used in Dell PowerEdge M1000e blade chassis – and possibly some newer Dell PowerConnect standalone switches too – are based on Broadcom FASTPATH silicon. While this hardware base introduces a plethora of other issues to be covered in detail in a separate article, it also introduces the possibility of breaking backwards compatibility with older Dell PowerConnect models from a monitoring point of view. Therefore, the new checks to cover the Broadcom FASTPATH based hardware were moved to a entirely new namespace. The file names of the new checks now use the prefix dell_powerconnect_bcm_ in contrast to the already existing stock Check_MK checks with their prefix dell_powerconnect_. Another difference to the stock Check_MK checks is the use of the FASTPATH Enterprise MIBs, which are specific to devices based on Broadcom silicon. The only exemptions are the checks dell_powerconnect_bcm_global_status and the dell_powerconnect_bcm_dnsstats, both monitor items which are not covered by the FASTPATH Enterprise MIBs.
All checks have been verified to work with the firmware versions 5.1.8.x and 5.1.9.x. For the newly introduced check dell_powerconnect_bcm_global_status the firmware version 5.1.9.4 or later is needed in order to avoid spurious error messages in the switch event log. See the section Additional Checks below for a more detailed explanation.
The discontinued, modified and additional checks are described in greater detail in the following three respective sections:
Discontinued Checks
The two service checks dell_powerconnect_fans and dell_powerconnect_psu provided by the standard Check_MK distribution have become redundant for the Dell PowerConnect M-Series switches. The items to be monitored by both are not present in those devices, since the Dell PowerEdge M1000e blade chassis provides both central cooling and power supply facilities. Accordingly, the cooling and power supply facilities should be monitored via the Dell Chassis Managment Controller.
Modified Checks
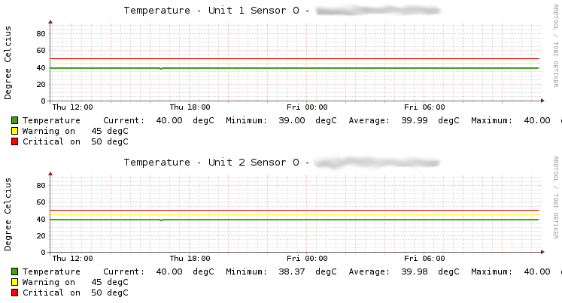
The two service checks dell_powerconnect_cpu and dell_powerconnect_temp have been renamed to dell_powerconnect_bcm_cpu and dell_powerconnect_bcm_temp respectively. They both have been modified to use the new Dictionary based parameters and factory settings for the CPU and temperature warning and critical levels. A SNMP example output for all OIDs used has been added to both service checks for documentation purposes. Manual pages, PNP4Nagios templates, WATO and Perf-O-Meter plugins have also been added for both service checks. With the added WATO plugins it is now possible to configure the CPU and temperature warning and critical levels through the WATO WebUI. The configuration options for the CPU levels can be found under:
-> Host & Service Parameters
   -> Parameters for discovered services
      -> Operating System Resources
         -> Dell PowerConnect CPU usage
            -> Create rule in folder ...
               [x] The levels for the overall CPU usage on Dell PowerConnect switches
The configuration options for the temperature levels can be found under:
-> Host & Service Parameters
   -> Parameters for discovered services
      -> Temperature, Humidity, Electrical Parameters, etc.
         -> Dell PowerConnect temperature
            -> Create rule in folder ...
               [x] Temperature levels for Dell PowerConnect switches
The following image shows a status output example for the dell_powerconnect_bcm_cpu service check from the WATO WebUI:
Three average CPU utilization values for the time sample intervals 5, 60 and 300 seconds are checked. The Perf-O-Meter is split accordingly into three sections in order to be able to display all three average CPU utilization values at once.
The following image shows a status output example for the dell_powerconnect_bcm_temp service check from the WATO WebUI:
This example shows the status and the current values of the temperature sensors in a switch stack with two switch members.
The following two images show examples of PNP4Nagios graphs for both service checks:
Additional Checks
Overview
The following table shows a condensed overview of the additional Check_MK service checks and their available components.
| Service check name | Description | Alarm | Manpage | PNP4Nagios template | Perf-O-Meter plugin | WATO plugin |
|---|---|---|---|---|---|---|
dell_powerconnect_bcm_arp_cache | Checks the current number of entries in the ARP cache against default or configured warning and critical threshold values. | yes | yes | yes | yes | yes |
dell_powerconnect_bcm_cos_queue | Determines the number of packets dropped at each CoS queue for the CPU. | yes | yes | |||
dell_powerconnect_bcm_cpu_proc | Monitors the CPU utilization on a per process level. | yes | yes | yes | yes | |
dell_powerconnect_bcm_dnsstats | Determines the number of DNS queries (total and several error states defined by RFC 1035) of the systems resolver. | yes | yes | |||
dell_powerconnect_bcm_global_status | Determines the global status of the “product”, via a Dell-specific SNMP OID. | yes | yes | |||
dell_powerconnect_bcm_ip_conflict | Determines if an IP address conflict has been detected on the switch. | yes | yes | |||
dell_powerconnect_bcm_logstats | Determines the number of log messages (total, dropped, relayed to syslog hosts) generated on the system. | yes | yes | |||
dell_powerconnect_bcm_mbuf | Determines the number of memory/message buffer allocations – or failures thereof – for packets arriving at the systems CPU. | yes | yes | |||
dell_powerconnect_bcm_memory | Monitors the current memory usage. | yes | yes | yes | yes | yes |
dell_powerconnect_bcm_sntp | Checks the current status of the SNTP client on the switch. | yes | yes | yes | yes | |
dell_powerconnect_bcm_ssh_sessions | Checks the number of currently active SSH sessions against the default limit of five allowed SSH sessions. | yes | yes | yes | yes | yes |
The first two columns should be pretty self-explanatory.
The Alarm column shows which checks will generate alarms based on the particular parameters monitored. Checks without an entry in the Alarm column are designed purely for long-term trends via their respective PNP4Nagios templates. All checks with an entry in the Alarm column use the new Dictionary based parameters and factory settings for their respective warning and critical levels. Where reasonable, those warning and critical levels are configurable through the WATO WebUI via an appropriate WATO plugin. See the last column, titled WATO plugin for the checks this applies to.
Manual pages are provided for each service check for documentation purposes. A SNMP example output is provided as a comment within the check script for all the OIDs used in the service check.
For all checks with an entry in the PNP4Nagios template column, a PNP4Nagios templates is provided in order to properly display the performance data delivered by the service check. Perf-O-Meter plugins are provided where reasonable, in order to display selected performance metrics in the service check overview of a host.
The specifics of each additional Check_MK service check are described in greater detail in the following sections.
ARP Cache
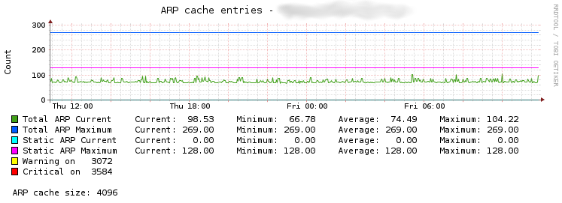
The Check_MK service check dell_powerconnect_bcm_arp_cache monitors the current total number of entries in the ARP cache on Dell PowerConnect switches. This number is compared to either the default or configured warning and critical threshold values, and an alarm is raised accordingly. With the added WATO plugin it is possible to configure the warning and critical levels through the WATO WebUI and thus override the default values (warning: 3072; critical: 3584). The configuration options for the ARP cache levels can be found under:
-> Host & Service Parameters
   -> Parameters for discovered services
      -> Operating System Resources
         -> Dell PowerConnect ARP cache
            -> Create rule in folder ...
               [x] The levels for the number of ARP cache entries on Dell PowerConnect switches
The following image shows a status output example for the dell_powerconnect_bcm_arp_cache service check from the WATO WebUI:
This example shows the current number of entries in the ARP cache along with the warning and critical threshold values.
In addition to the already mentioned total number of entries in the ARP cache, several other metrics are also collected as performance data. These are the overall ARP cache size, the number of static ARP entries and the peak values for both the current and the static number of ARP entries. The following image shows an example of the PNP4Nagios graph for the service check:
CoS Queue
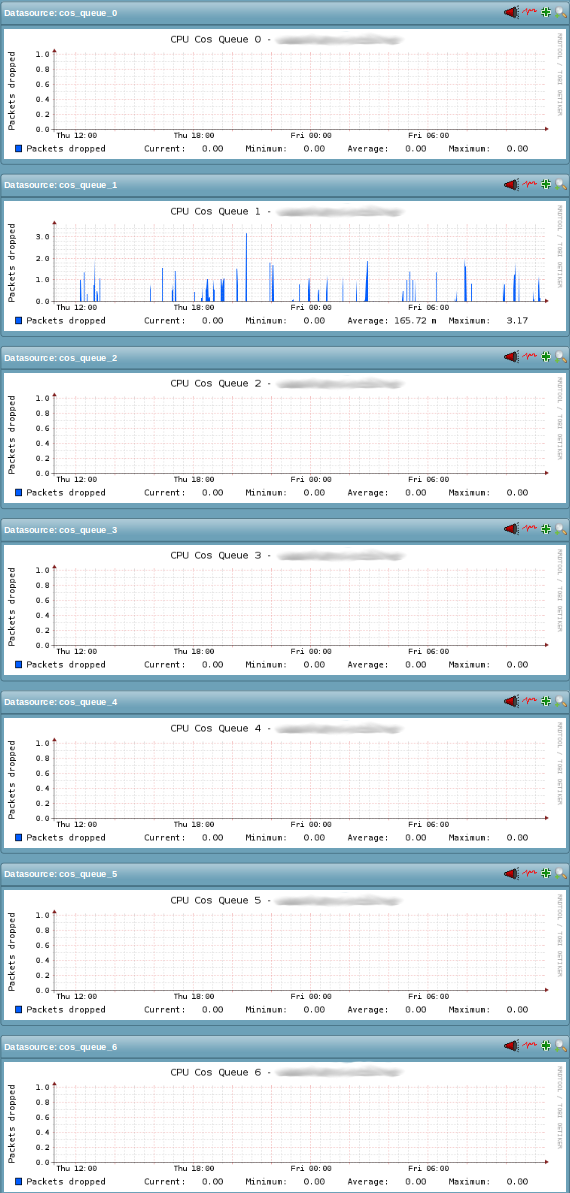
The Check_MK service check dell_powerconnect_bcm_cos_queue monitors the number of packets dropped at each CoS queue for the CPU (quoted from the FASTPATH Enterprise MIB). Unfortunately the only other description available in the FASTPATH Enterprise MIBs is almost as cryptic as the first one: Number of packets dropped at this CPU CoS queue because the queue was full. The metric probably relates to the switches Class of Service (CoS) feature in a Quality of Service (QoS) setup. Currently, the dell_powerconnect_bcm_cos_queue service check is used purely for long-term trends via its respective PNP4Nagios template and thus only gathers its metrics as performance data.
The following image shows a status output example for the dell_powerconnect_bcm_cos_queue service check from the WATO WebUI:
The following image shows an example of the PNP4Nagios graph for the service check:
Process CPU Usage
The Check_MK service check dell_powerconnect_bcm_cpu_proc monitors the same CPU utilization metrics as the previously described dell_powerconnect_bcm_cpu service check, but on a more detailed, per process level. The three average CPU utilization values for the time sample intervals 5, 60 and 300 seconds are for each process compared to either the default or configured warning and critical threshold values and an alarm is raised accordingly. There is currently the limitation in the checks logic that warning and critical threshold values apply globally to all processes. Individual warning and critical threshold values for each process are currently not supported. With the added WATO plugin it is possible to configure the warning and critical levels through the WATO WebUI and thus override the default values (warning: 80%; critical: 90%) for the average CPU utilization. The configuration options for the per process CPU utilization levels can be found under:
-> Host & Service Parameters
   -> Parameters for discovered services
      -> Operating System Resources
         -> Dell PowerConnect CPU usage (per process)
            -> Create rule in folder ...
               [x] The levels for the per process CPU usage on Dell PowerConnect switches
The following image shows a status output example for the dell_powerconnect_bcm_cpu_proc service check from the WATO WebUI:
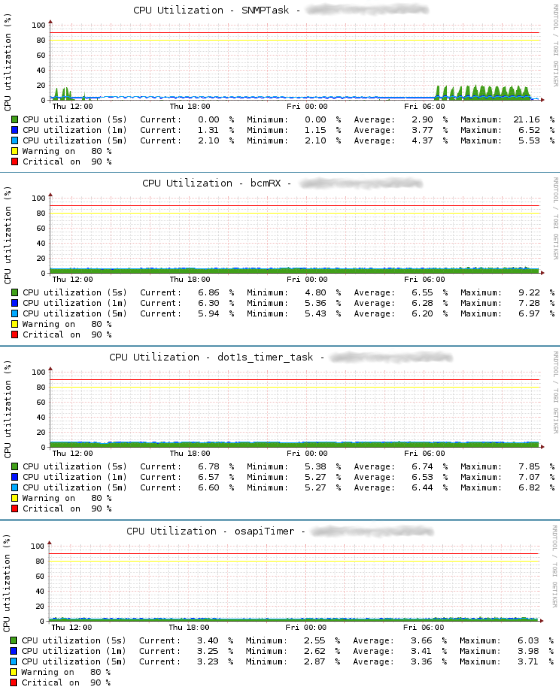
The following image shows only four examples of PNP4Nagios graphs for the service checks:
The selected example graphs show the average CPU utilization over the 5, 60 and 300 seconds time sample intervals for the processes SNMPTask, bcmRX, dot1s_timer_task and osapiTimer. Mind though that this is only a small selection of the various processes that can be found running on the Broadcom FASTPATH based Dell PowerConnect switches. Some processes are always to be found, others appear only after a specific feature – covered by appropriate processs – is enabled on the switch. Unfortunately i've not been able to find a complete list of the possible processes nor a good and comprehensive description of the purpose of each process. Sometimes – like in the case of the process SNMPTask – the purpose can be guessed from process name. So overall i'd say the per process CPU utilization metric is probably best used as a metric for long-term trends in conjunction with support from Broadcom or Dell, when dealing with a specific issue on the switch or an unusually high CPU utilization of a specific process.
DNS Statistics
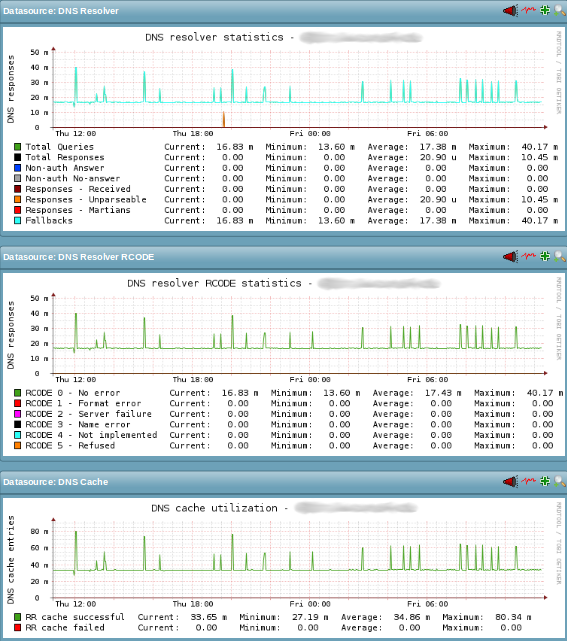
The Check_MK service check dell_powerconnect_bcm_dnsstats monitors various aspects and metrics of the switches local DNS resolver. The metrics gathered can be grouped into three categories:
DNS Resolver: The number of DNS resolver queries and the number of DNS responses to those queries. For the DNS responses the number of responses in each response category. The response categories are: Non-auth Answers, Non-auth No-answer, Received Responses, Unparsable Responses, Martians Responses and Fallbacks.
DNS Resolver RCODE: The number of DNS resolver responses by resonse code. See 1035 for the details on DNS response codes.
DNS Cache: The number of DNS resouce records that have been successfully added or have failed to be added to the DNS resolver cache.
See 1612, 1035 and the service checks man page for a detailed description of the metrics covered by the dell_powerconnect_bcm_dnsstats service check. Currently, the dell_powerconnect_bcm_dnsstats service check is used purely for long-term trends via its respective PNP4Nagios template and thus only gathers its metrics as performance data.
The following image shows a status output example for the dell_powerconnect_bcm_dnsstats service check from the WATO WebUI:
The following image shows an example of the three PNP4Nagios graphs for the service check:
Global Status
The Check_MK service check dell_powerconnect_bcm_global_status monitors just one metric, the productStatusGlobalStatus from the Dell Vendor MIB for PowerConnect devices. As the name of the metric suggests, it represents an aggregated global status for a Dell PowerConnect device. The global status can assume one of the three values, shown in the following table:
| Numeric Value | Textual Value | Description |
|---|---|---|
| 3 | OK | “If fans and power supplies are functioning and the system did not reboot because of a HW watchdog failure or a SW fatal error condition.” |
| 4 | Non-critical | “If at least one power supply is not functional or the system rebooted at least once because of a HW watchdog failure or a SW fatal error condition.” |
| 5 | Critical | “If at least one fan is not functional, possibly causing a dangerous warming up of the device.” |
While the information about the fan and PSU status is redundant for the Dell PowerConnect M-Series switches, the information about hard- and software error conditions might be quite valueable.
When we first implemented the enhanced version of the Dell PowerConnect monitoring checks, we noticed spurious error messages suddenly appearing in the switch event log and subsequently in our syslog servers. The messages showing up looked like the following example:
<189> OCT 14 12:48:50 <Management IP address>-1 MGMT_ACAL[251047504]: macal_api.c(873) 38462 %% macalRuleActionGet(): List does not exist.
Disabling one check after another, we narrowed the source of this error message down to the dell_powerconnect_bcm_global_status service check. Logging a support case with Dell eventually lead to the following explaination from Dell PowerConnect engineering:
Hi Frank,
I got an update from our engineering team and they can see the problem
when snmpwalk is executed against switch but issue is not seen if snmpget
is executed on all OIDs.
They are working on a fix.
Once fix is available it will be included in the next FW patch release
for this switch. […]
At the time we were running the newest available firmware, which back then was version 5.1.9.3. After updating to the firmware version 5.1.9.4 which was released later on, the above error messages stopped showing up.
IP Address Conflict Detection
The Check_MK service check dell_powerconnect_bcm_ip_conflict monitors the status of the built-in IP address conflict detection feature of a Dell PowerConnect switch. If an IP address conflict is detected, an alarm with the status warning is raised. In addition to the alarm status, the service check will also report the conflicting IP, (if available) the MAC address of the device causing the conflict and the date and time the conflict was detected. The last bit of information is relative to the switches date and time settings. Needless to say, a properly configured date and time or a time synchronisation via NTP on the siwtch is quite helpful in such a case.
Once an IP address conflict is detected by a Dell PowerConnect switch, this status will not resolve itself automatically or time out in any way. The issue has to be acknowledged manually on the Dell PowerConnect switch. This can be achieved e.g. on the switchs' CLI with the following commands:
switch> enable
switch# clear ip address-conflict-detect
Log Statistics
The Check_MK service check dell_powerconnect_bcm_logstats monitors several metrics of the logging facility on Dell PowerConnect switches. These are the:
total number of log messages received by the log process, including dropped and ignored messages.
number of dropped log messages, which could not be processed by the log process due to an error or lack of resources.
number of relayed log messages. These are log messages which have been forwarded to a remote syslog host by the log process. If multiple remote syslog hosts are configured, each message is counted multiple times, once for each of the configured syslog hosts.
Currently, the dell_powerconnect_bcm_logstats service check is used purely for long-term trends via its respective PNP4Nagios template and thus only gathers its metrics as performance data.
The following image shows a status output example for the dell_powerconnect_bcm_logstats service check from the WATO WebUI:
The following image shows an example of the PNP4Nagios graph for the service check:
Unfortunately the information as to why log messages might have been erroneous or which resources (CPU cycles, free memory, etc.) were missing at the time of processsing the log message is scarce. The metrics about the logging facility are therefore – again – probably best used as metrics for long-term trends in conjunction with support from Broadcom or Dell, when dealing with a specific issue on the switch.
Memory Buffers
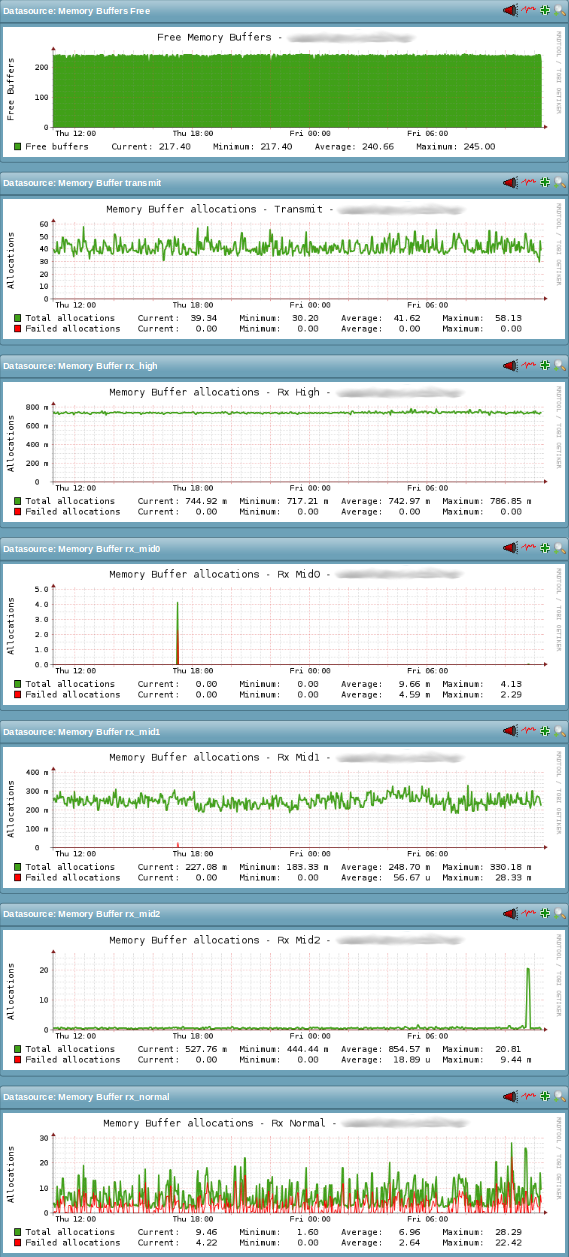
The Check_MK service check dell_powerconnect_bcm_mbuf monitors two groups of metrics regarding the memory or message buffers on Dell PowerConnect switches. The first group is the overall number of currently available memory or message buffers on the switch. This group consists of just one metric. The second group is the number of total and the number of failed memory or message buffer allocation attempts for packets arriving at the switches CPU. Those two metrics are gathered for each of memory or message buffer classes. The names of the currently available memory or message buffer classes are “Transmit”, “Rx High”, “Rx Mid0”, “Rx Mid1”, “Rx Mid2” and “Rx Normal”.
The dell_powerconnect_bcm_mbuf service check is currently used only for long-term trends via its respective PNP4Nagios template and thus only gathers its metrics as performance data.
The following image shows a status output example for the dell_powerconnect_bcm_mbuf service check from the WATO WebUI:
The following image shows an example of the seven PNP4Nagios graphs for the service check. One graph for the overall available memory or message buffers and one graph for the allocation attempts on each of the six memory or message buffer classes:
Similarly to the process names described in the previous section Process CPU Usage, i've also not been able to find a good and comprehensive description of the memory or message buffer classes defined on the Broadcom FASTPATH based Dell PowerConnect switches. Some meaning can again be derived from the name of the particular memory or message buffer class, but it is much more limited than in case of the process names. Beyond that, questions like the following – but not limited to – immediately come to mind:
which type of packets are forwarded to the CPU instead of being directly processed by the switching silicon of the device?
why are there several receive classes (“Rx …”) but only one transmit class?
what is the difference between the multiple receive classes and by what algorithm are packets assigned to a specific receive class?
what is likely the root cause of a failed memory or message buffer allocation attempt?
what are the effects of a failed memory or message buffer allocation attempt. Are packets going to be dropped due to this, or is the allocation attempt retried?
what design, implementation and configuration options should be taken into consideration in order to avoid failed memory or message buffer allocation attempts?
Unfortunately they remain unanswered due to the lack of comprehensive documentation. The metrics regarding the memory or message buffers are therefore – again – probably best used for long-term trends in conjunction with support from Broadcom or Dell, when dealing with a specific issue on the switch.
Memory Usage
The Check_MK service check dell_powerconnect_bcm_memory monitors the current memory (RAM) usage on Dell PowerConnect switches. The amount of currently free memory is compared to either the default or configured warning and critical threshold values, and an alarm is raised accordingly. With the added WATO plugin it is possible to configure the warning and critical levels through the WATO WebUI and thus override the default values (warning: 51200 KBytes; critical: 25600 KBytes of free memory). The configuration options for the free memory levels can be found under:
-> Host & Service Parameters
   -> Parameters for discovered services
      -> Operating System Resources
         -> Dell PowerConnect memory usage
            -> Create rule in folder ...
               [x] The levels for the amount of free memory on Dell PowerConnect switches
The following image shows a status output example for the dell_powerconnect_bcm_memory service check from the WATO WebUI:
This example shows the current amount of free memory and the total memory size both measured in kilobytes.
The following image shows an example of the PNP4Nagios graph for the service check:
SNTP Statistics
The Check_MK service check dell_powerconnect_bcm_sntp monitors the current status of the SNTP client on Dell PowerConnect switches. In order to achieve this, the check iterates over the list of SNTP servers configured as time references for the SNTP client on the switch. For each configured SNTP server, the status of the last connection attempt from the SNTP client on the switch to that particular SNTP server is evaluated. The overall number of SNTP servers with a connection status equal to success is counted and this number is compared to either the default or configured warning and critical threshold values, and an alarm is raised accordingly. With the added WATO plugin it is possible to configure the warning and critical levels through the WATO WebUI and thus override the default values (warning: 1 ; critical: 0 servers successfully connected). The configuration options for the levels of successful SNTP server connections can be found under:
-> Host & Service Parameters
   -> Parameters for discovered services
      -> Applications, Processes & Services
         -> Dell PowerConnect SNTP status
            -> Create rule in folder ...
               [x] Successful SNTP server connections on Dell PowerConnect switches
The following image shows a status output example for the dell_powerconnect_bcm_sntp service check from the WATO WebUI:
This example shows the current status of the SNTP client which has successfully connected the one configured SNTP server.
In addition to the aggregated current connection status of the SNTP client to all configured SNTP servers, two other metrics are – for each SNTP server – collected as performance data. These are the overall number of SNTP requests – including retries – and the number of failed SNTP requests the client made to a particular SNTP server. The following image shows an example of the PNP4Nagios graph for the service check:
SSH Sessions
The Check_MK service check dell_powerconnect_bcm_ssh_sessions monitors just one metric, the number of currently active SSH sessions on the Dell PowerConnect device. This number is compared to either the default or configured warning and critical threshold values, and an alarm is raised accordingly. With the added WATO plugin it is possible to configure the warning and critical levels through the WATO WebUI and thus override the default values (warning: 5; critical: 5 active SSH sessions). The configuration options for the number of active SSH sessions can be found under:
-> Host & Service Parameters
   -> Parameters for discovered services
      -> Applications, Processes & Services
         -> Dell PowerConnect SSH sessions
            -> Create rule in folder ...
               [x] Active SSH sessions on Dell PowerConnect switches
The following image shows a status output example for the dell_powerconnect_bcm_ssh_sessions service check from the WATO WebUI:
This example shows the current number of active SSH sessions along with the warning and critical threshold values.
The following image shows an example of the PNP4Nagios graph for the service check:
Conclusion
Adding the enhanced version of the Dell PowerConnect monitoring checks to your Check_MK server enables you to monitor various additional aspects of your Dell PowerConnect devices. New Dell PowerConnect devices should pick up the additional service checks immediately. Existing Dell PowerConnect devices might need a Check_MK inventory to be run explicitly on them in order to pick up the additional service checks.
Along with the built-in Check_MK monitoring of interfaces of network equipment, the monitoring of services (SSH, HTTP and HTTPS) and the status of certificates, as well as the previously described monitoring of RMON Interface Statistics, this enhanced version of the Dell PowerConnect monitoring checks enables you to create a complete monitoring solution for your Dell PowerConnect M-Series switches.
I hope you find the provided new and enhanced checks useful and enjoyed reading this blog post. Please don't hesitate to drop me a note if you have any suggestions or run into any issues with the provided checks.
Leave a comment…
- E-Mail address will not be published.
- Formatting:
//italic// __underlined__
**bold**''preformatted'' - Links:
[[http://example.com]]
[[http://example.com|Link Text]] - Quotation:
> This is a quote. Don't forget the space in front of the text: "> "
- Code:
<code>This is unspecific source code</code>
<code [lang]>This is specifc [lang] code</code>
<code php><?php echo 'example'; ?></code>
Available: html, css, javascript, bash, cpp, … - Lists:
Indent your text by two spaces and use a * for
each unordered list item or a - for ordered ones.


